
The Golden Ratio in Finance: Mystical Math or Market Edge?
The Golden Ratio—approximately 1.618—has captivated mathematicians, artists, architects, and scientists for centuries. Often referred to as the divine proportion, it appears in nature, geometry, human anatomy, and even music. But perhaps one of its most curious appearances is in the world of financial markets.
This blog explores what the Golden Ratio really is and how it’s applied in finance—from technical analysis to quantitative modeling—to forecast trends, price levels, and investor behavior.
What Is the Golden Ratio?
The Golden Ratio, denoted by the Greek letter phi (φ), is defined mathematically as:
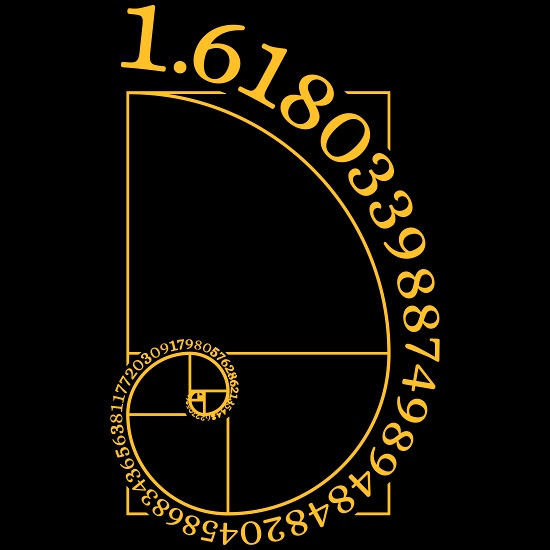
φ = (1 + 5^1/2)/2 ≈1.6180339887…
It arises when a line segment is divided such that the ratio of the whole to the larger part is equal to the ratio of the larger part to the smaller. If you have two quantities, a and b (where a > b), they are said to be in the golden ratio if:
(a+b) / a = a/b = ϕ
This ratio is also evident in the Fibonacci sequence—a series of numbers where each number is the sum of the two preceding ones:
0,1,1,2,3,5,8,13,21,34,55,…
As you go further in the sequence, the ratio between consecutive Fibonacci numbers converges to φ (e.g., 21/13 ≈ 1.615, 34/21 ≈ 1.619).
This self-replicating pattern is seen in sunflower seeds, spiral galaxies, hurricanes—and some say, in the stock market.
The Golden Ratio in Finance
The Golden Ratio forms the mathematical foundation of Fibonacci tools widely used in technical analysis. Traders and analysts believe that market movements often retrace in Fibonacci ratios, and thus these levels can help forecast key reversal points, support/resistance, and momentum exhaustion.
1. Fibonacci Retracements
Fibonacci retracement levels are horizontal lines that indicate where support and resistance are likely to occur. These are derived by taking two extreme points (usually a swing high and a swing low) and dividing the vertical distance by Fibonacci ratios: 23.6%, 38.2%, 50%, 61.8%, and 78.6%.
Why 61.8%? That’s the inverse of φ (1/1.618 ≈ 0.618). It suggests that a strong trend might retrace around 61.8% before continuing in the same direction.
📌 Example: If a stock rallies from $100 to $160, a 61.8% retracement suggests a potential pullback to:
160−(0.618×60)=160−37.08=122.92
These levels are used to set entry, stop-loss, and profit targets.
2. Fibonacci Extensions
While retracements deal with pullbacks, Fibonacci extensions are used to forecast where the price may go beyond a swing high or low.
Common extension levels include:
161.8% (φ)
261.8%
423.6%
These levels help identify where the next resistance or target price may be, especially in a strong trend or breakout scenario.
📌 Example: If a stock moves from $100 to $150, retraces to $120, the 161.8% extension would predict a new target of:
120+(1.618×(150−100))=120+80.9=200.9
3. Time-Based Fibonacci Tools
Fibonacci is not just for price. It can also be applied to time analysis. Tools like:
-
Fibonacci Time Zones – vertical lines at Fibonacci intervals from a start date.
-
Fibonacci Arcs – combine price and time.
-
Fibonacci Fans – diagonal trend-based levels.
These help traders anticipate when a major move might occur, not just where.
Behavioral Finance and Market Psychology
A key question remains: Why do Fibonacci levels “work”?
The truth lies more in psychology than in any fundamental market mechanism. Here’s why:
-
Self-fulfilling prophecy: Millions of traders use Fibonacci tools. If enough of them place orders around the 61.8% retracement, the price may actually reverse around that level, reinforcing the belief.
-
Human cognition: Studies show people naturally divide space and time in golden proportions. This cognitive bias might subconsciously affect how we perceive markets.
-
Herd behavior: When a critical mass of traders watch the same levels, their collective actions create real market impacts—support, resistance, volume spikes.
In this sense, the Golden Ratio isn’t magical—it’s a behavioral benchmark embedded in trading psychology.
In Quantitative Finance
While retail traders use Fibonacci tools visually, quants and data scientists have found deeper mathematical applications of the Golden Ratio in:
-
Scaling transformations: φ appears in fractals and log-periodic structures in price data.
-
Mean reversion models: Time-based Fibonacci indicators help in modeling cyclical returns.
-
Volatility clustering: Wave-based models and algorithms may use Fibonacci cycles.
-
Portfolio optimization: Some quant strategies apply Fibonacci proportions in risk-parity or asset weighting schemes.
Limitations & Criticism
Despite its popularity, the Golden Ratio is not a standalone predictive tool. Critics argue that:
-
Subjectivity: Different traders may anchor Fibonacci tools at different price points.
-
Confirmation bias: Traders may unconsciously fit patterns to support the Fibonacci narrative.
Final Thoughts
The Golden Ratio blends elegance, psychology, and market structure into a simple yet powerful tool. It may not have predictive magic, but it provides guidance, context, and probabilistic support for market decisions.
From ancient geometry to modern trading screens, φ continues to fascinate, inspire, and serve as a compass for those who seek patterns in the chaos of the markets.